Fields
Overview
Configure which estimate fields and capacity metrics are visible in the Capacity view, control how values are calculated, and define how color logic is applied. This includes customizing metric displays, adjusting color thresholds, and enabling options that affect how capacity, commitment, and velocity data are interpreted across iterations.
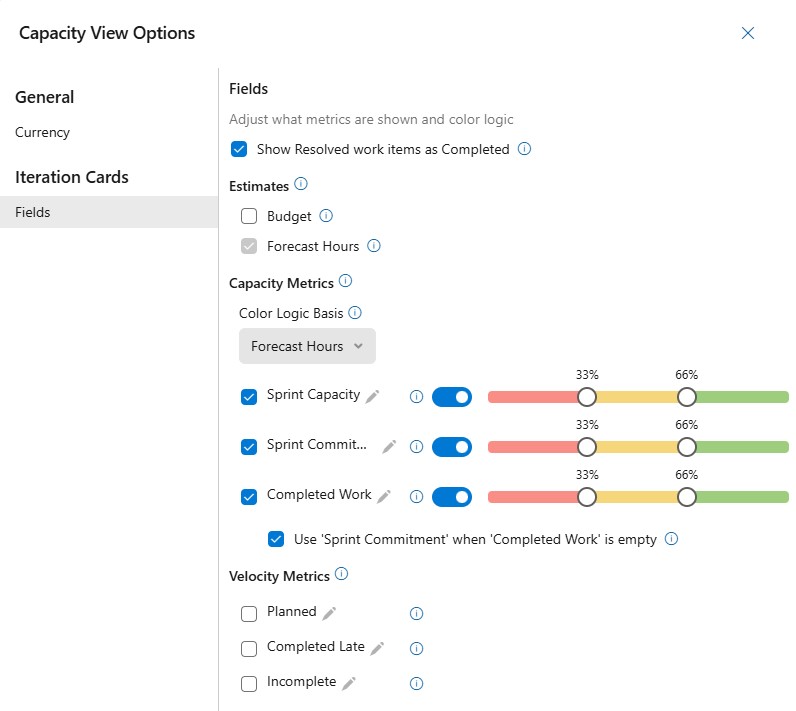
Show Resolved work items as Completed
Consider work items with State or StateCategory 'Resolved' as Completed work items
- Default: Disabled
- Applies to: Roadmap and Capacity view
Estimates
Toggle estimate fields on or off without affecting saved data.
- Budget: Show or hide the field
- Forecast (Hours/Points/Effort/Size): Show or hide the field.
Capacity Metrics
Shows team capacity, commitment, and completed work per iteration, generated directly from Azure DevOps to highlight team over or under commitments at a glance. Capacity metrics can be color coded based on the Forecast, or the Team's Sprint Capacity.
Color Logic Basis: The value used to determine pill colors. The selected Color Logic Basis cannot be disabled, the checkbox is greyed out.
Color Coding: The pill value is divided by the basis to calculate a percentage, which is displayed as red, yellow, or green.
- Forecast: User-entered budgeted value (Hours/Points/Effort/Size) per team per Iteration.
- Sprint Capacity: Total team commitment (Hours/Points/Effort/Size) for the Iteration from Capacity view.
Example
If Forecast Hours = 100 (used as the Color Logic Basis):
- Sprint Capacity = 80 → 80% → Green
- Sprint Capacity = 50 → 50% → Yellow
- Sprint Capacity = 20 → 20% → Red
Metric Pill Sliders

- Checkbox: Show or hide the field.
- Pencil Icon: Edit the field label to match your project needs.
- Info Icon: Description of the metric field.
- Toggle: Turn color coding on or off for this metric.
- Color Sliders: Set the range for each displayed color.
Use ‘Sprint Commitment’ when ‘Completed Work’ is empty
- Enabled by default
- Available only at the Task Backlog level
- If the ‘Completed Work’ is empty (not zero), ‘Original Estimate’ is used to calculate ‘Completed Work’
Velocity Metrics
Shows historical team performance per iteration, based on Azure DevOps data. Velocity metrics break down planned work, work completed late, and work left incomplete to help improve future iteration forecasts.
- Planned: The sum of all effort that were in the Iteration on it's start date.
- Completed Late: The sum of all effort that were completed after the Iteration's end date.
- Incomplete: The sum of all in-progress effort that were not completed before the Iteration's end date.